oratop - Oracle Database Monitoring Tool
oratop이란?
오라클이 제공하는 Oracle Call Interface(OCI) API를 이용한, 텍스트 기반 데이터베이스 모니터링 툴입니다. 현재 데이터베이스 활동 상태와 성능을 모니터링하고, 경합과 병목지점을 식별할 수 있습니다. 오라클 데이터베이스 11gR2 버전부터 지원하며, 유닉스 top 유틸리티와 유사한 인터페이스를 가지고 있습니다.
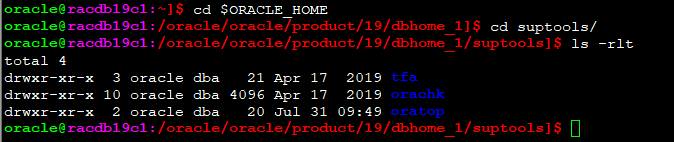
바이너리 파일 위치
oracle$ cd $ORACLE_HOME/suptools
oracle$ ls
oratop tfa
주요 특징
- 프로세스, SQL 모니터링
- 실시간 Wait Event
- Active Data Guard 지원
- 멀티태넌트 CDB 지원
수행방법
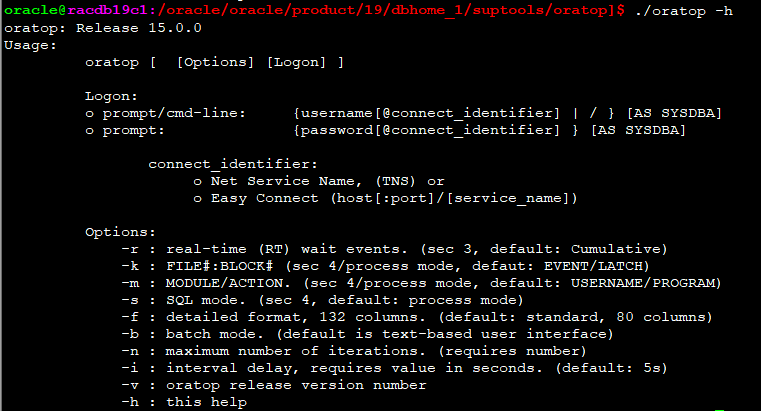
./oratop -h
=> 수행방법 및 도움말.
local 데이터베이스를 모니터링 할 경우
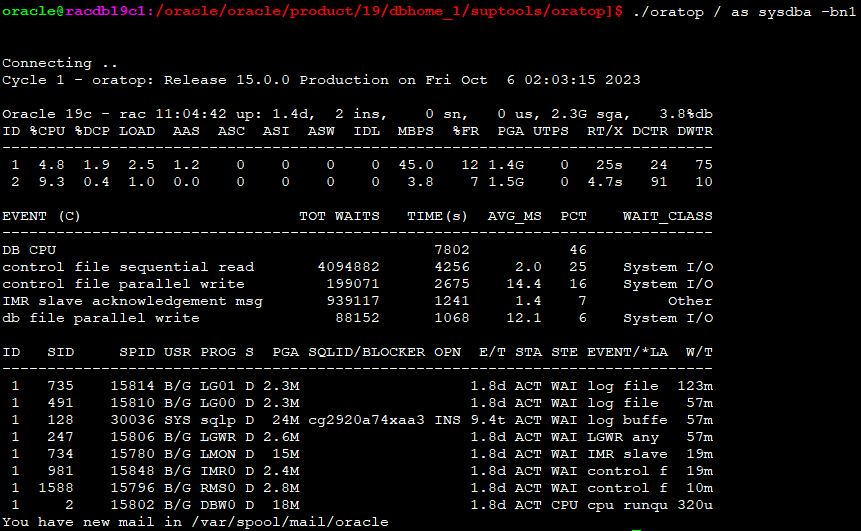
$ ./oratop -i 10 / as sysdba
remote 데이터베이스를 모니터링 할 경우
$ ./oratop -i 10 username/password@tns_alias
$ ./oratop -i 10 system/manager@tns_alias
예)
./oratop -i 10 -f -m / as sysdba
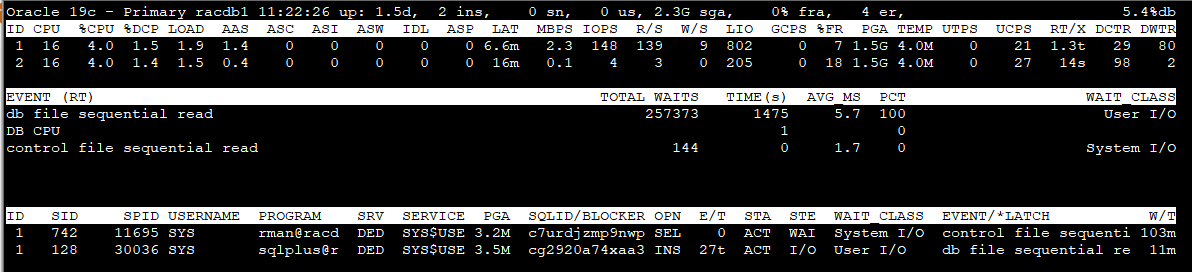
10초 간격으로 Module/Action 정보를 포함해서 상세 포맷으로 데이터베이스 정보를 출력하도록 oratop을 실행해보겠습니다.
참고로, 데이터베이스 statistics_level 레벨이 "BASIC"으로 설정되어 있으면, oratop이 모니터링 정보를 제대로 가져올 수 없다.

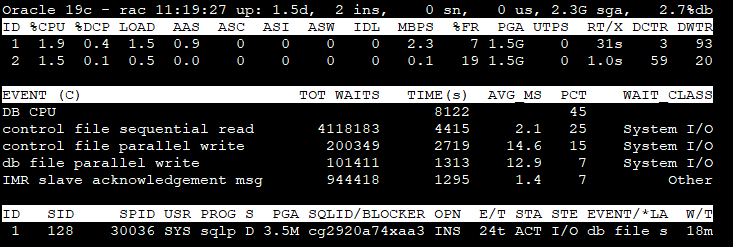
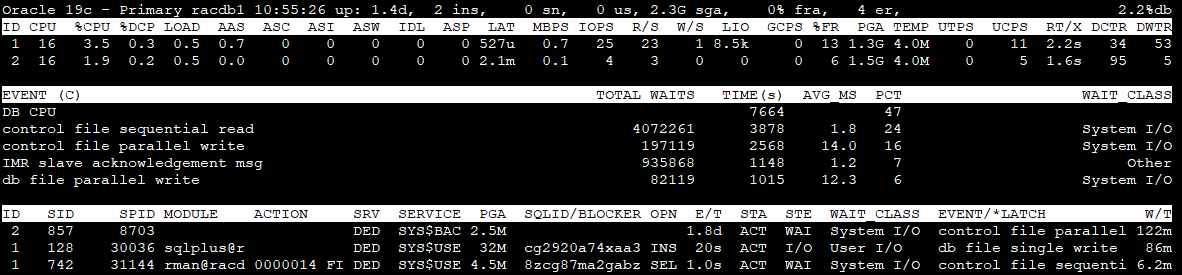
기본 모드로 보인다.(standard format)
f 입력시 자세한 모드로 볼 수 있다.(detailed format)
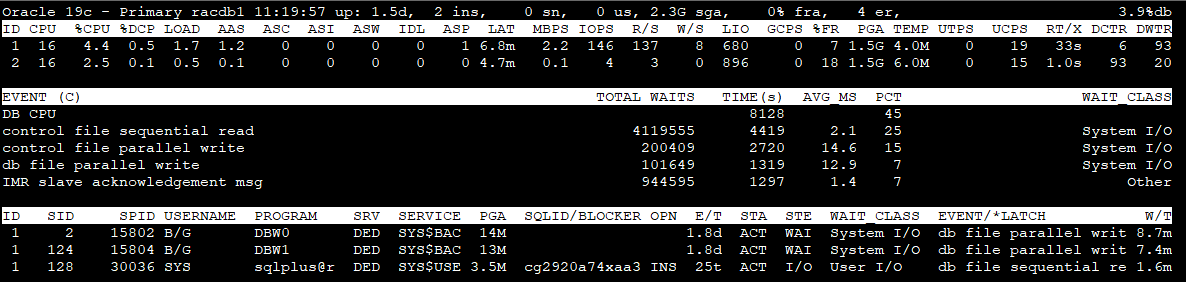
각 항목의 의미
Section 1 - Global Database information
Version : Oracle major version
role : database role
db name : db_unique_name
time : time as of the most recent stats (hh24:mi:ss)
up : database uptime (UTC)
ins : total number of instance(s)
sn : total user sessions (non-predefined)
us : number of distinct users (non-predefined)
sga : system global area (SGA)
fra : flashback recovery area %used
er : diag active problem count (checked once at start)
%db : %Active Database (work)
Section 2 - Top 5 Instance(s) Activity ordered by Database Wait Time Ratio Desc
ID : Instance Id.
CPU : CPU Count
%CPU : Host CPU Utilization (%busy)
%DCP : Database cpu usage as %CPU
LOAD : Current OS Load
AAS : Average Active Sessions (dbtime (s/s))
ASC : Active Sessions on CPU
ASI : Active Sessions waiting on User I/O
ASW : Active Sessions Waiting on other events
IDL : Idle User Sessions (non-predefined)
ASP : Active Parallel Sessions (F/G)
LAT : Average Synchronous Single-Block Read Latency (Threshold: 20ms)
MBPS : I/O Megabytes per Second (throughput R/W)
IOPS : I/O Requests per second (R/W)
R/S : Physical Read Total IO Requests Per Sec
W/S : Physical Write Total IO Requests Per Sec
LIO : Logical Reads Per Sec
GCPS : GC (CR+Current) Block Received Per Second
%FR : Shared Pool Free %
PGA : Total PGA Allocated
TEMP : Temp Space Used
UTPS : User Transaction Per Sec
UCPS : User Calls Per Sec
RT/X : Response Time Per Txn
DCTR : Database CPU Time Ratio
DWTR : Database Wait Time Ratio
Section 3 - Top 5 Timed Events ordered by wait time desc (Cluster-wide, non-idle)
EVENT : wait event name
(RT) : Real-Time mode
TOTAL WAITS : total waits
TIME(s) : total wait time in seconds)
AVG_MS : average wait time in milliseconds
PCT : percent of wait time (all events)
WAIT_CLASS : name of the wait class
Section 4 - Non-Idle processes ordered by event wait time desc.
ID : inst_id
SID : session identifier
SPID : oraserver process os id
MODULE : Name of the currently executing module
ACTION : Name of the currently executing action
SRV : SERVER (dedicated, shared, etc.)
SERVICE : db service_name
PGA : pga_used_mem
SQL_ID/BLOCKER : sql_id or the final blocker's (inst:sid)
OPN : operation name, e.g. select
E/T : session elapsed time (active/inactive)
STA : ACTive|INActive|KILled|CAChed|SNIped
STE : process state, e.g. on CPU or user I/O or WAIting
WAIT_CLASS : wait_class for the named event
EVENT/*LATCH : session wait event name. Auto toggle with *latch name
W/T : event wait time (Threshold: 1s)
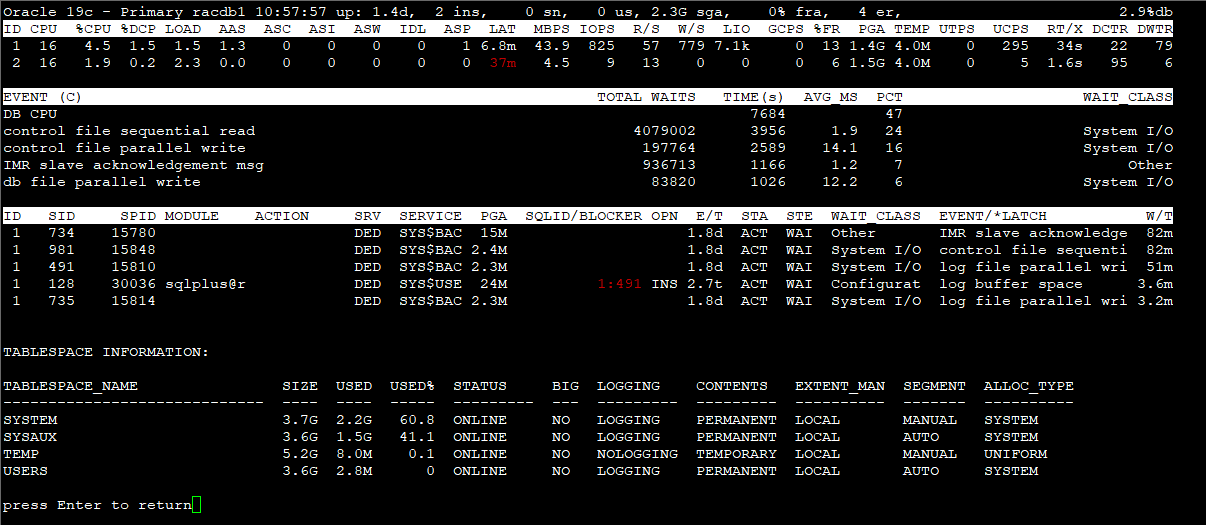
t를 누르면 테이블 스페이스 정보를 얻을 수 있다.
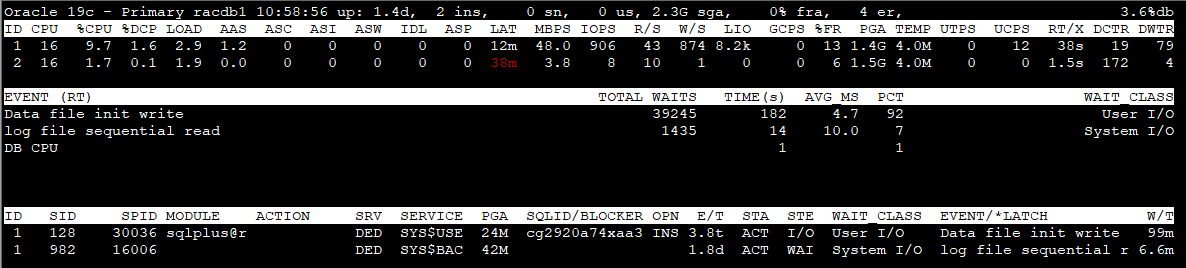
r을 누르면 Wait Event 정보를 볼 수 있다.
batch mode
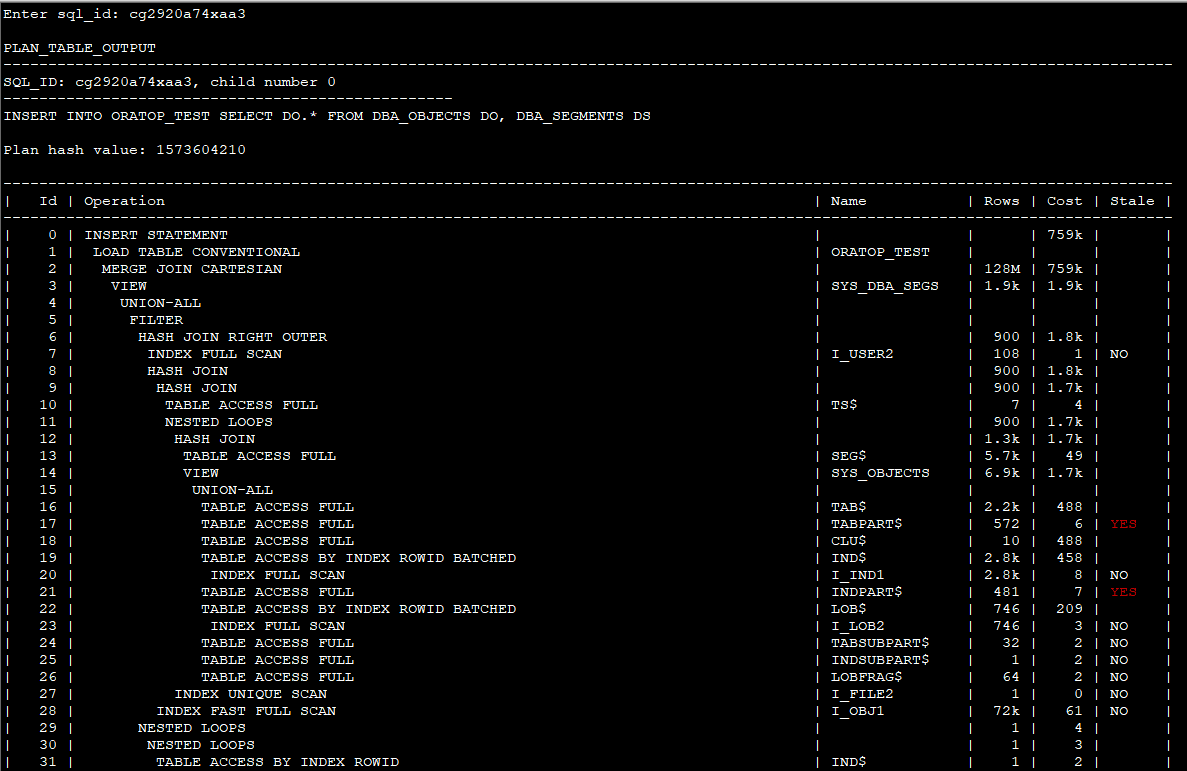
x 키보드 눌렀을 경우
sql에 대한 정보를 볼 수 있는 화면이 나옴.

SQL의 실행계획을 볼 수 있다.
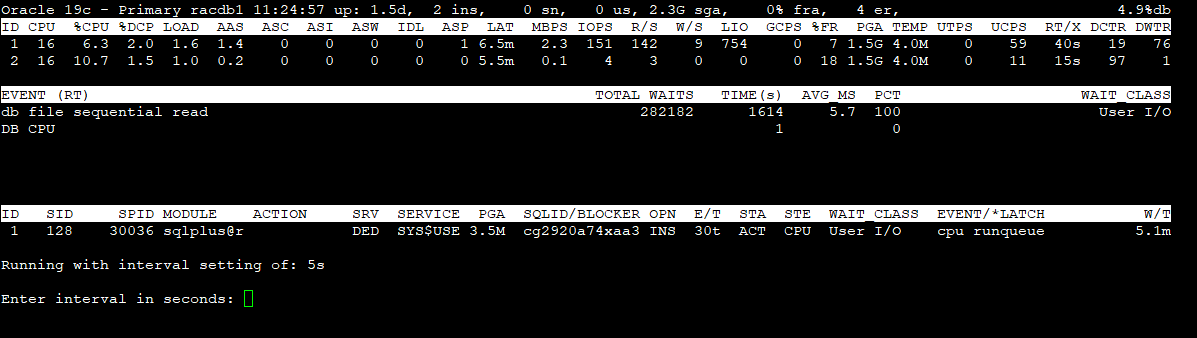
p 키보드를 눌렀을 경우 (session/process 모드)
i 키보드를 눌렀을 경우 갱신되는 주기를 입력할 수 있다. (초단위)
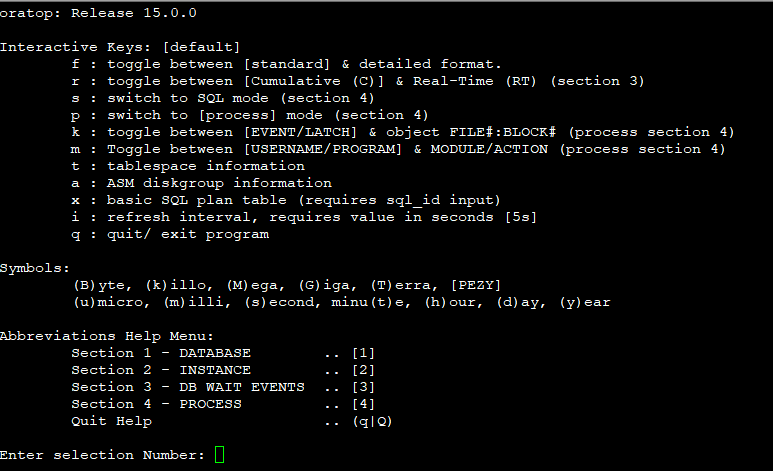
h 키보드를 눌렀을 경우 help를 볼 수 있다.
참고문서
oratop - Utility for Near Real-time Monitoring of Databases, RAC and Single Instance (Doc ID 1500864.1)
https://feellikeghandi.tistory.com/12